This post may contain affiliate links. I only recommend products I use and love. Read the full disclosure here
Updated on: February 5, 2026
Originally published on: February 5, 2026
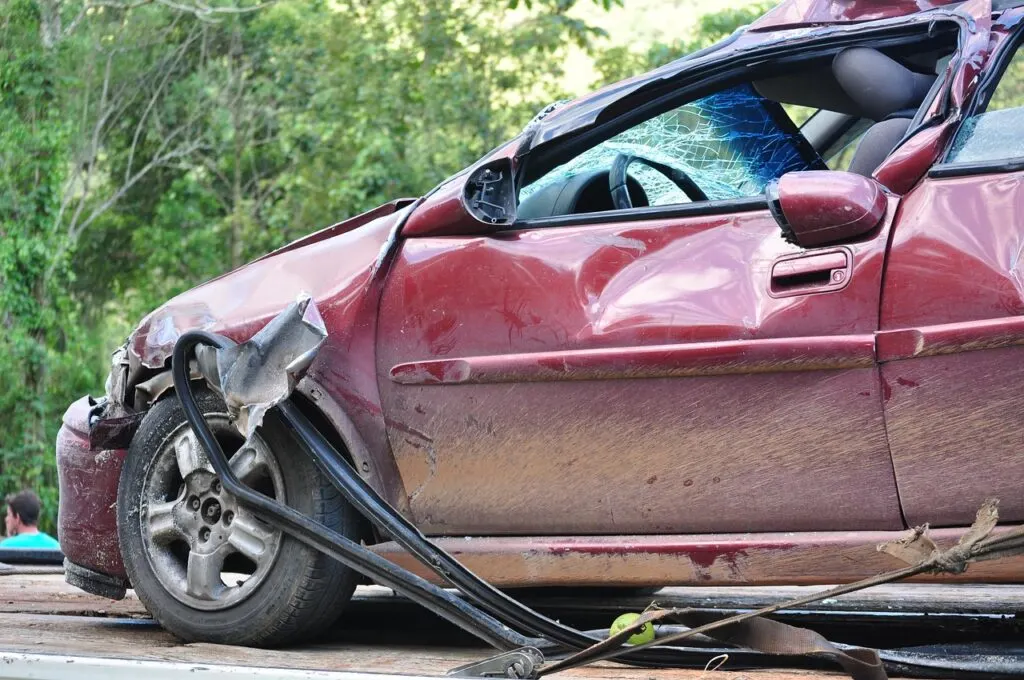
Accidents look sudden, but the explanation is built step by step. Through accident reconstruction, investigators gather facts, test ideas, and let the evidence drive the story instead of guesswork. The goal is simple but strict: show what happened, how it happened, and why it happened, using methods that stand up to questions from both engineers and juries.


The First Hours: Locking Down The Scene
Time is the enemy. Weather, traffic, and cleanup can erase key marks in minutes. Skilled teams move fast to document everything before it disappears.
They capture what the eye can miss. Skid and yaw marks, debris paths, crush zones, and fluid trails all map motion and energy. Measurements come with timestamps, coordinates, and notes on lighting and road friction, so the data can be trusted later.
- Establish a safe perimeter and traffic control
- Photograph wide, medium, and close views from fixed points
- Record final rest positions of people, vehicles, and debris
- Log road grade, surface type, and any hazards or sight limits
- Note weather, lighting, and temporary conditions like lane closures
- Collect witness details while memories are fresh
Measuring What Matters: Tools and Discipline
Modern scenes are scanned, not just sketched. Investigators use laser scanners, total stations, and calibrated cameras to build a record that is both precise and repeatable. Ground control points and scale bars tie photos to real-world units.
Data quality is a mindset, not just a device. An industry article from Envista Forensics observed that a reconstruction is only as strong as the measurements behind it. That is why teams plan coverage, control error sources, and check that instruments and workflows follow accepted procedures.
From Photos To 3D – How The Scene Comes Alive
Pictures alone rarely tell the full story. That is why teams build 3D models and animations to test ideas and to learn more about visual solutions that make complex motion clear. These visuals help experts compare competing hypotheses and pick the one that fits the evidence best.
A 3D scene lets you see lines of sight, approach angles, and the timing of each move. It shows how small choices ripple into large outcomes. It also makes underlying math visible without drowning people in formulas.
Why 3D is more than a picture
Good models are measurable. Distances, speeds, and clearances can be read off the model the same way they would be on the roadway. That means the model is not art; it is another instrument that must be calibrated and verified.
Vehicles Tell a Story – But Not The Whole Story
Vehicles carry digital clues. Event data recorders, airbag modules, and other systems may hold speed change, throttle, brake, and belt status. These details can be powerful when they match the physical record.
They also have limits that pros respect. A 2024 paper from SAE reported that roughly 10 to 13 percent of speed change values written by some event data recorders can be off by more than 10 percent, so investigators cross-check electronic readouts against tire marks, crush depth, and time-distance studies. When data streams disagree, the physical scene and tested physics lead.
Cross-checks that reduce risk
- Compare EDR speed change to energy from crush and skid work
- Verify pre-impact paths with debris fields and contact points
- Align timestamps between cameras, phones, and module clocks
- Reconcile vehicle orientation with scrape marks and panel damage
- Rebuild steering and braking inputs using mark patterns and ABS behavior
Physics Makes It Plain: Speed, Force, Timing
At the core are simple laws. Momentum explains the push and pull between vehicles at impact. Energy links speed to damage and sliding distance. Time-distance shows whether a driver had a chance to see, react, and stop.
Experts test ranges, not just one number. They run best-case and worst-case inputs to see how the outcome shifts. If a small change flips the result, they flag that sensitivity and collect more data to close the gap.
People and Process: Collaboration Keeps It Honest
Reconstruction is a team sport. Engineers, human factors specialists, medical experts, and visualization artists each bring a unique perspective to the puzzle. Regular reviews ensure that everyone is aligned on facts and assumptions.
Chain of custody and documentation
Every file, scan, and sample needs a clear trail. Teams log who collected it, when, where, and how it was handled. That record protects the integrity of the work and helps the court follow the path from scene to finding.
Guardrails against bias
Hypotheses are useful, but they must earn their keep. Analysts write down assumptions, test alternatives, and let counter-evidence break weak ideas. The documented method matters as much as the result.
Turning Findings into Courtroom Narratives
Clarity wins. Experts build a storyboard that moves from setting to action to outcome. Each panel links back to data so a juror can see the source and understand the step.
Simple visuals carry heavy loads. A timeline lined up with animation frames helps show reaction windows. Cutaways of vehicle interiors explain seat positions, restraints, and airbag timing. Maps with sight lines make it easy to judge what was visible and when.

What Can Skew a Reconstruction
Even good data can mislead if the context is missing. Pros work hard to spot and correct the traps that cause errors. They assume nothing and verify everything with independent checks.
- Scene changes after cleanup hide or shift evidence
- Low light, glare, or rain distorts camera images
- Slopes and surface types change how far vehicles slide
- ABS reduces classic skid marks and can fool a glance
- GPS time drift desyncs recordings across devices
- Witness memory fades or blends details over time
- Module clocks and sampling rates create timing offsets
- Scale or lens errors in photos warp measurements if uncorrected
Why this Careful Method Matters
Accidents can look chaotic, but a disciplined method turns noise into a timeline you can test. Careful measurements, a clean chain of custody, and cross-checks keep opinions from slipping into guesswork.
When physics is run across a range of inputs, and those results line up with road marks, module data, and visuals built from verified numbers, confidence grows for both experts and the court. That rigor protects everyone involved – it reduces bias, flags uncertainty, and builds findings that stand when challenged.
In the end, the work is about fairness. Good reconstructions show what happened and what did not, in plain terms. That clarity helps decision makers reach outcomes they can trust.